

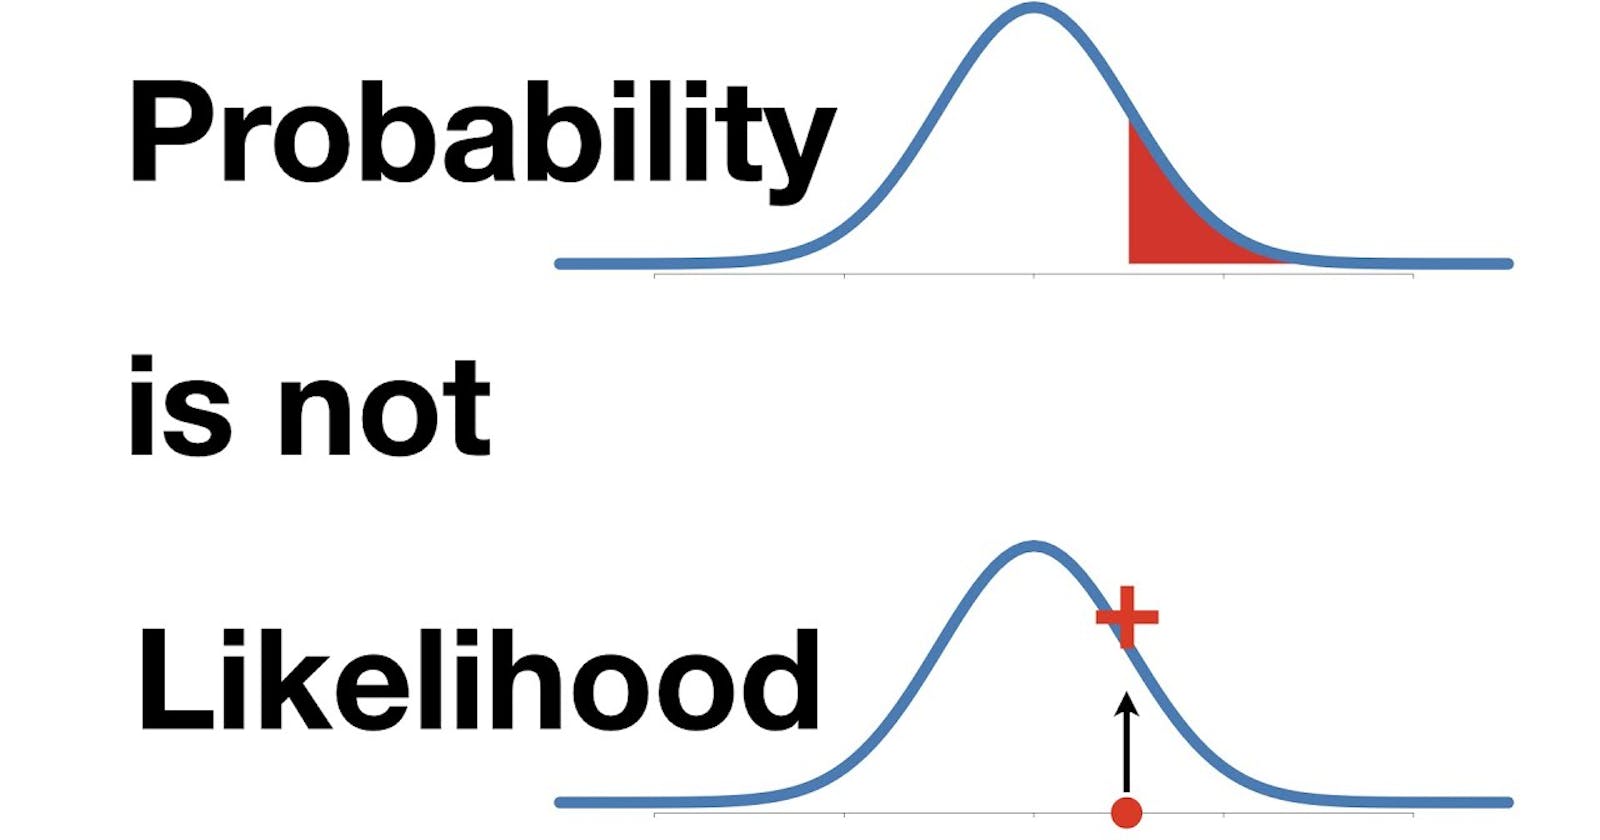
When I first came across the term 'Likelihood' in the same sentence having the word 'Probability', I was very confused and could not make any sense of that statement! This actually happened while I was learning about maximum likelihood estimation for logistic regression. The reason for this confusion was my common day understanding that the likelihood of something refers to the probability of something and the often incorrect use of these terms interchangeably. I then started digging more in order to make any sense of that statement. And therefore, in this blog, I have tried to explain the difference between likelihood and probability.
Understanding Probability
The common understanding of Probability of an event is that it is the ratio of the favorable outcomes of the event to the total possible outcomes for the concerned experiment. (in the example of housing prices of a housing dataset, the event refers to getting a house having the price less than x, and the experiment refers to the random picking of a house from a sample).
Let's take a little deeper look at the above definition. The above definition of probability is defined over some underlying assumptions on the experiment, or the process of that experiment (like all houses are equally likely to be picked, all neighborhoods' houses are equally likely to be picked, etc.) that are known as the parameters of that experiment, \(\theta\).
When the parameters \(\theta\) of the experiment are fixed, it gives a specific probability density function or probability distribution (in the case of discrete variables) for the outcomes of an event. Given the probability density function, the probability of an event can be easily computed by finding the area under the curve for the concerned event as shown in the below image for house prices more than x.
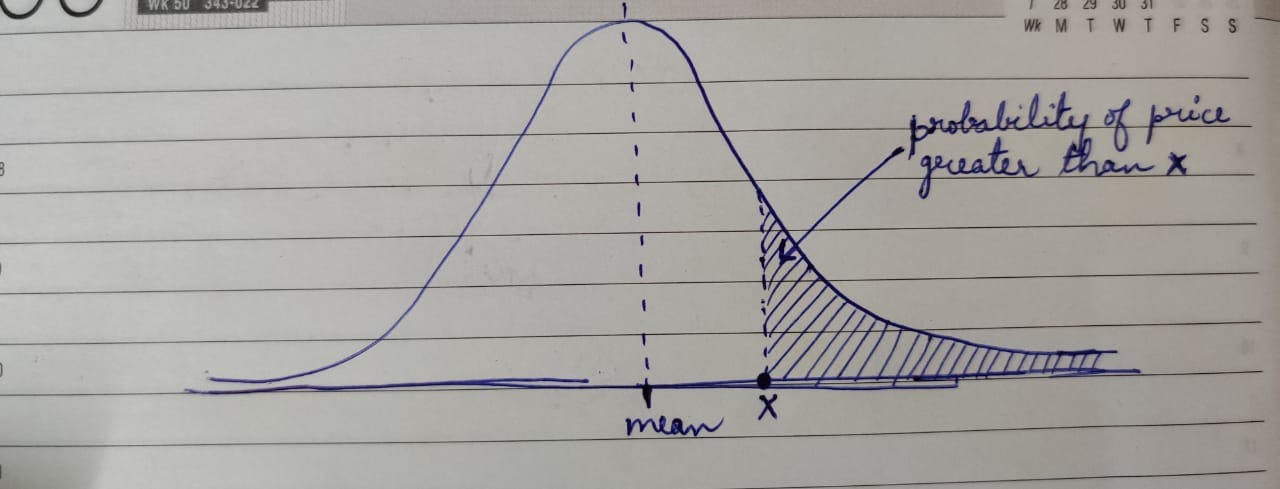
This means that if a house is picked, the probability of its price being more than x is given by the area of the shaded region in the above image.
Mathematical representation
Given the parameters \(\theta\), the probability of an event is formally represented as:
P(price > x | mean = y and variance = z).
Note: For the purpose of this example, I have assumed the houses price as a normal distribution with some mean and variance. The concept is valid for all distributions. The mean and variance are the characteristics of the PDF (and define its position and shape respectively) and hence are written on the right-hand side of the 'pipe' symbol in the formal representation.
Since the parameters \(\theta\) define the PDF, and changing the parameters can change the PDF, it can also be wirtten as:
P(price > x | \(\theta\)) or P(data | \(\theta\))
This implies that given the fixed process parameters, the probability of an event or a value will change on changing the event. For example, P(price > 100k | \(\theta\)) will be different from P(price > 80k | \(\theta\)).
Understanding Likelihood
Often when trying to model a real-world process, the parameters \(\theta\) are unknown. We observe the outcomes O and try to estimate the parameters \(\theta\) that are a plausible choice for the given observed outcomes O. This implies that given the observed outcomes O, we try to estimate the PDF or the probability distribution that best explains the observed outcomes O.
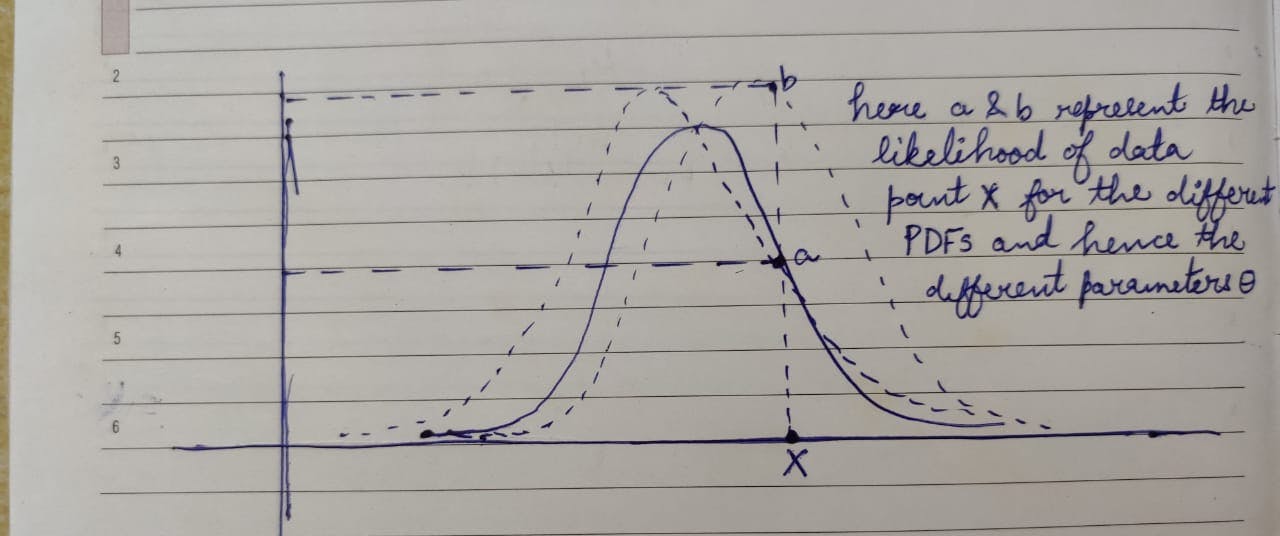
In the above image, as we keep changing the model parameters \(\theta\), we get different PDFs that give different values on the y-axis for the given data point x. These different values are known as the likelihood of the distribution.
Therefore, Likelihood is the plausability of a particular distribution explaining the given data. The higher the likelihood of a distribution, the more likely it is to explain the observed data.
In the housing price example given above to explain the probability, suppose we change the model or process parameters \(\theta\) (model parameters refer to some set of values that define the house picking process like, all the neighborhoods are not equally likely to be picked and the picking process has some inherent bias for one neighborhood over another, etc.) it will change the PDFs of the house prices and thus the likelihood of the distribution for the given data will change with the model parameters \(\theta\).
Mathematical representation
Mathematically likelihood for a given data is represented as:
L(\(\theta\) | data)
This implies that the model parameters are changed and the observed data is kept fixed.
Summary
Probability is how likely are the chances of a certain data to occur if the model parameters are fixed and Likelihood is the chances of a particular model parameter explaining the given observed data.
The mathematical representation of Probability and Likelihood have reverse order of occurrence for the observed data and the model parameters. In probability, the \(\theta\) appears on the right-hand side and is kept fixed while the data is varied, and in likelihood, the observed data appears on the right-hand side and is kept fixed while the model parameters \(\theta\) are varied.
Note: The same concept is valid for continuous variables as well as random variables.
I hope this blog would have helped you in understanding the crucial difference between probability and likelihood in the statistics world. If you have any doubts, or suggestions regarding the writing or the explanation of the concept, please let me know in the comments.